
How To Make A 3D Pie Chart In Illustrator
How To Make A 3D Pie Chart In Illustrator https://logosbynick.com/wp-content/uploads/2021/04/3d-pie-chart-tutorial.png 800 470 Nick Saporito https://secure.gravatar.com/avatar/8e31bf392f0ba8850f29a1a2e833cdd020909bfd44613c7e222072c40e031c34?s=96&d=mm&r=gIn today’s tutorial we’ll be going over a handy tool in Illustrator that allows you to make various kinds of charts and graphs — like a pie chart, for example. Then, we’ll be going over how to make that pie chart 3D. Making a 3D pie chart in Illustrator is simply a matter of using the Pie Graph Tool to generate the chart, then using the Extrude and Bevel effect to make it three dimensional.
One distinct advantage Adobe Illustrator has over other vector design applications is the abundance of tools and features it has — one of which being its ability to generate charts and graphs with relative ease. In other vector applications, these things need to be designed manually. In Illustrator though, there are dedicated tools that will generate them for you. All you have to do is input your data.
Make A 3D Pie Chart In Illustrator
The following video tutorial will walk you through the process of making a 3D pie chart in Illustrator:
Read on for the written instructions.
Step 1: Use The Pie Graph Tool To Generate Your Pie Chart
First, grab the Pie Graph Tool from the toolbox. The tool is located under the Column Graph Tool. You can access is by clicking and holding on the tool, which will reveal a flyout menu with various other tools for charts and graphs:
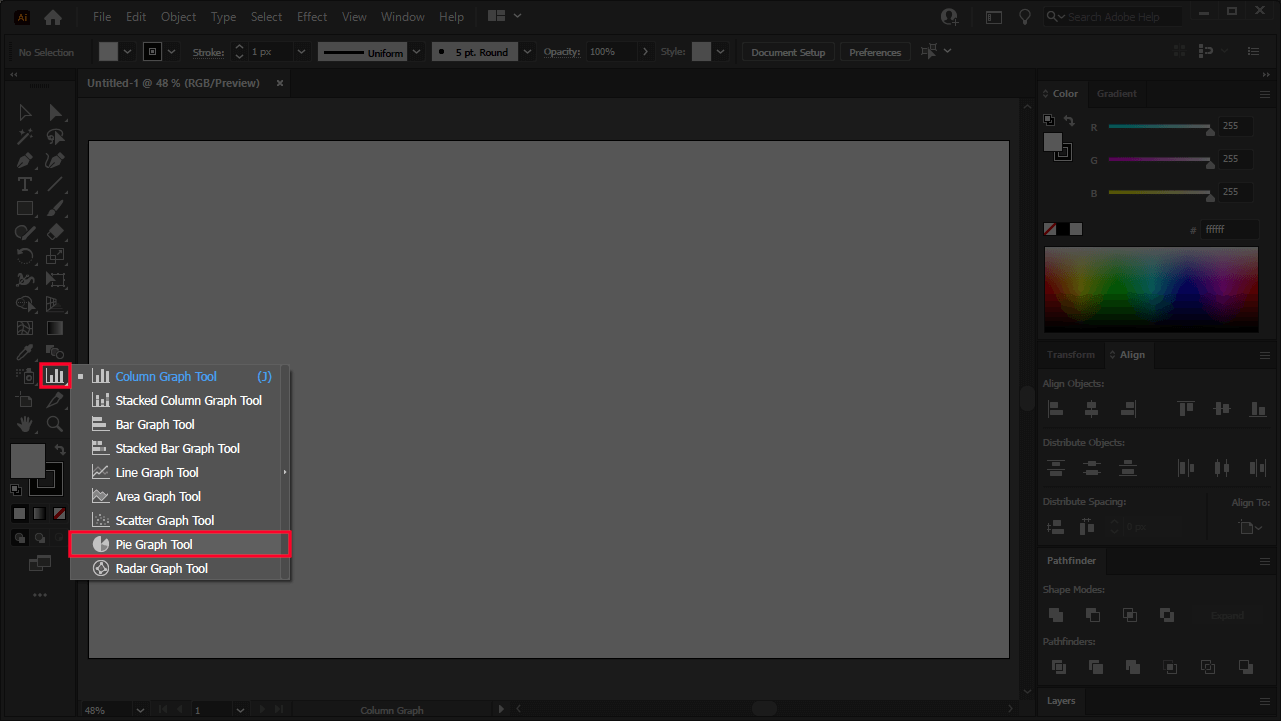
The Pie Graph Tool is nestled within the other bars and graphs tools.
If you do not see the column graph tool on your screen then it’s probably because you have the Basic toolbar enabled. Enable the Advanced toolbar by navigating to Window > Toolbars > Advanced.
With the Pie Graph Tool selected, simply click on the artboard once, and you will be prompted with a menu asking you to input the size you’d like your pie chart to be:
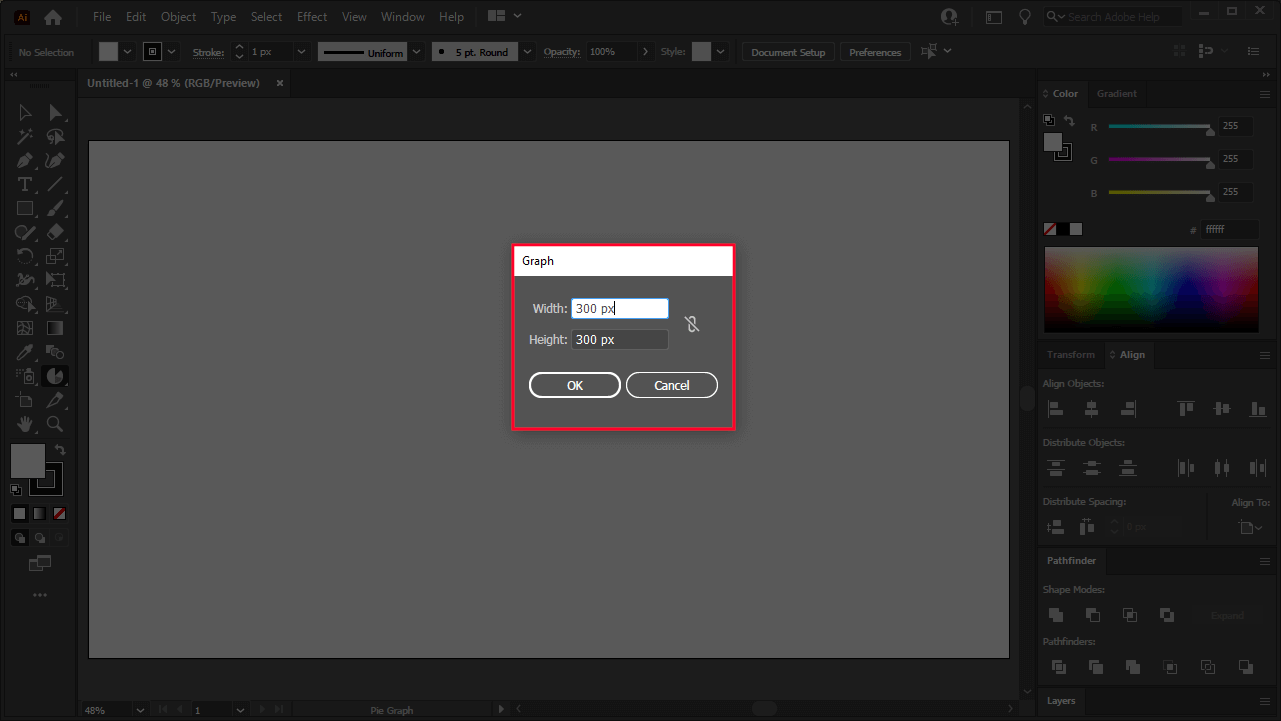
For this demonstration, the size is set to 300 x 300 px, but you can size yours however you’d like. It should be noted that the size of the pie chart is unimportant at this point. We can go back and resize it later on once it’s complete.
Once you set your size and click OK, you will notice a black circle has been generated on your artboard, and a window will pop up asking you to input the numerical values for your pie chart:
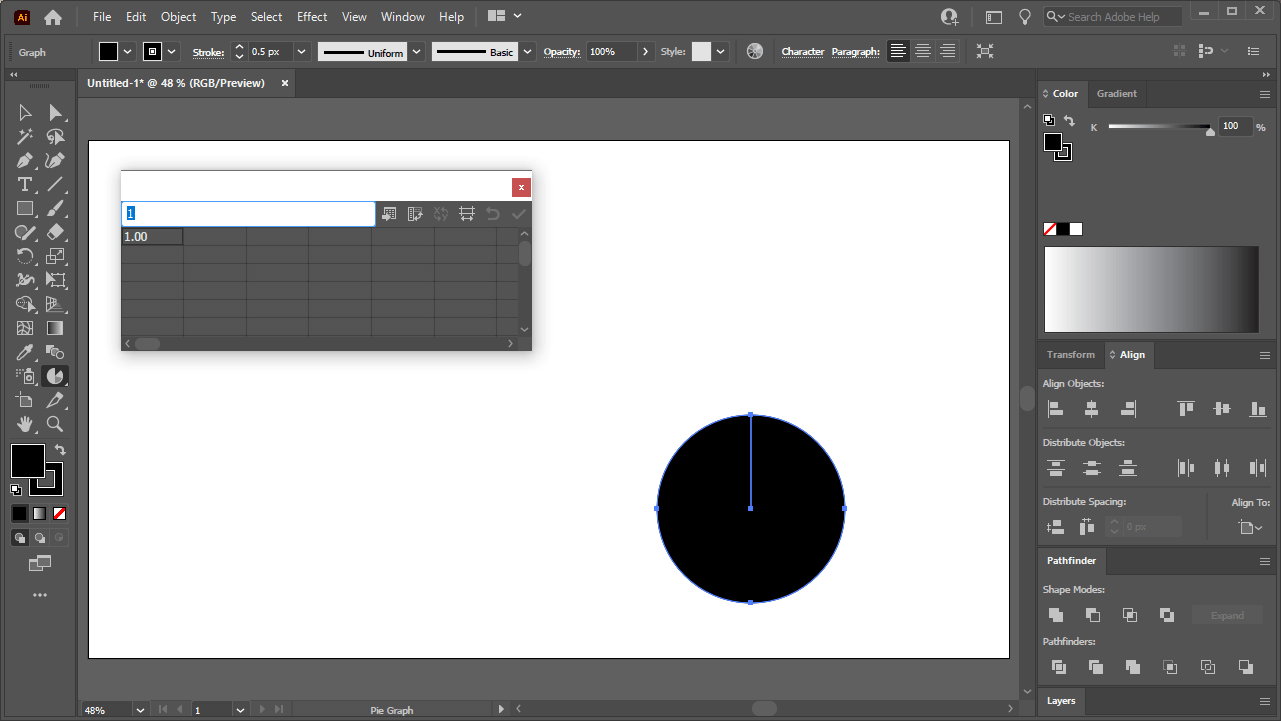
This is where we will dictate the segments of the pie chart.
Type in a numerical value for a single segment of the chart, then press Tab to enter the next segment. These numbers are based on percentages, so make sure that all of the segments add up to 100.
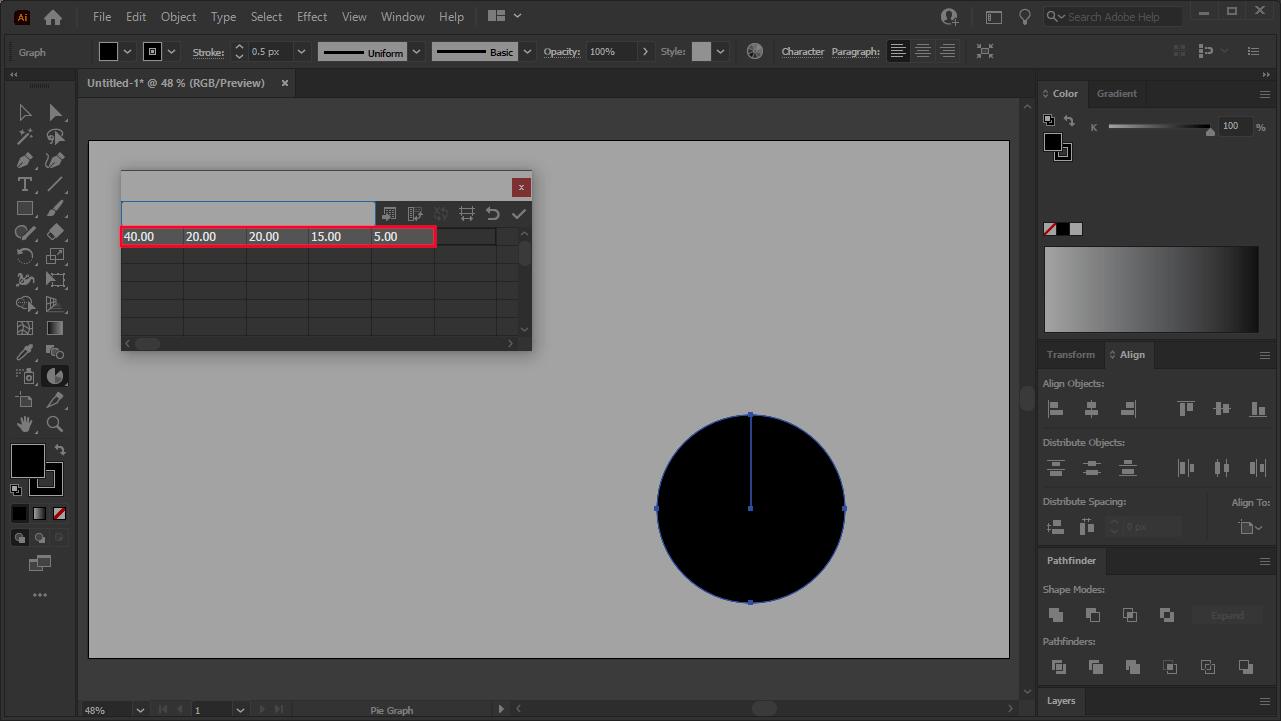
For this demonstration I will be using the following numerical values:
- 40%
- 20%
- 20%
- 15%
- 5%
This is how it looks once entered:
Once you are finished entering your numerical values, press the check icon in the top-right corner of the menu to apply these settings, or simply press Enter on your keyboard.
These changes will be reflected in your pie chart:
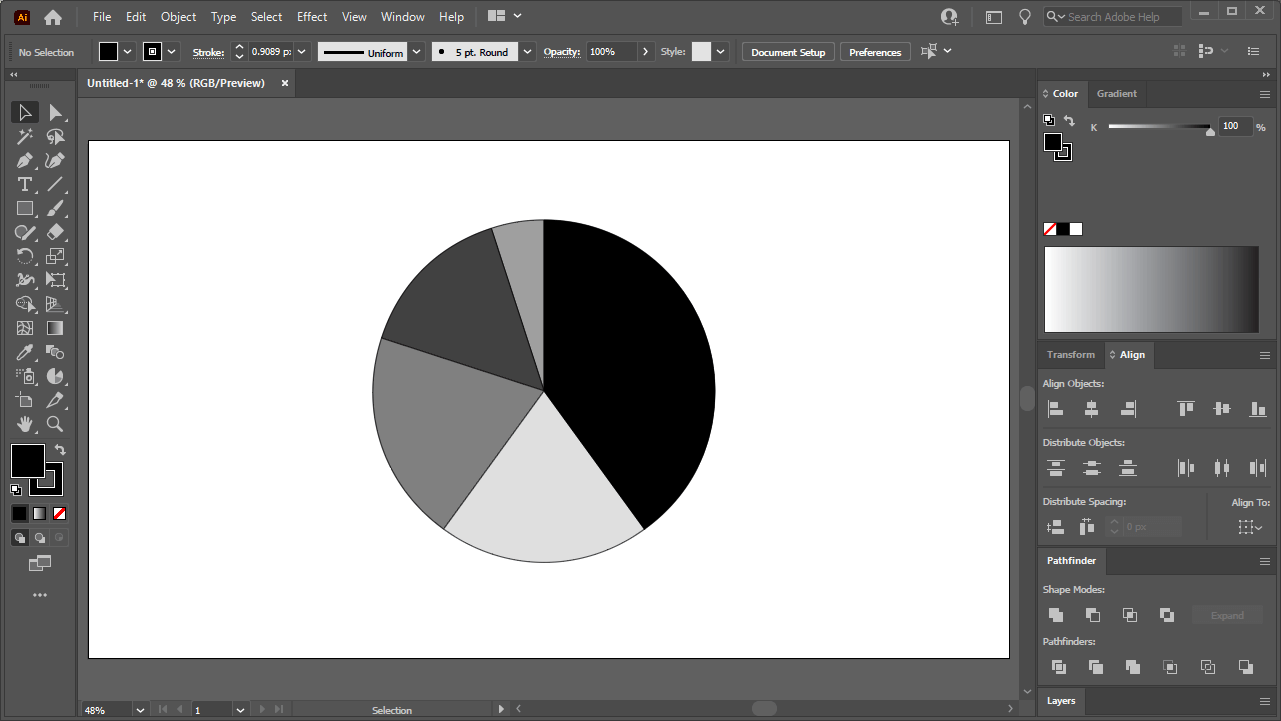
You can now close out of the pie chart menu and then Ungroup the pie chart so that you can edit it further. To do so, navigate to Object > Ungroup, or press Control + Shift + G on your keyboard. You will have to ungroup it twice.
By default, Illustrator adds a black stroke to the individual segments of your pie chart. Remove them before proceeding.
Step 2: Use The Extrude and Bevel 3D Effect To Make Your Pie Chart 3D
Now that we’re generated our pie chart, it’s time to make it three dimensional. To make a 3D pie chart with Illustrator, we need to use Illustrator’s built-in 3D effects.
Make sure you have your pie chart selected, then navigate to Effects > 3D > Extrude & Bevel. You will be prompted with a menu asking you to determine the angles of the X, Y and Z axis:

For this demonstration I am using the following presets:
- X axis: 60°
- Y axis: 0°
- Z axis: 0°
You can also click and drag the blue and gray box on the left if you’d like to set the angles manually.
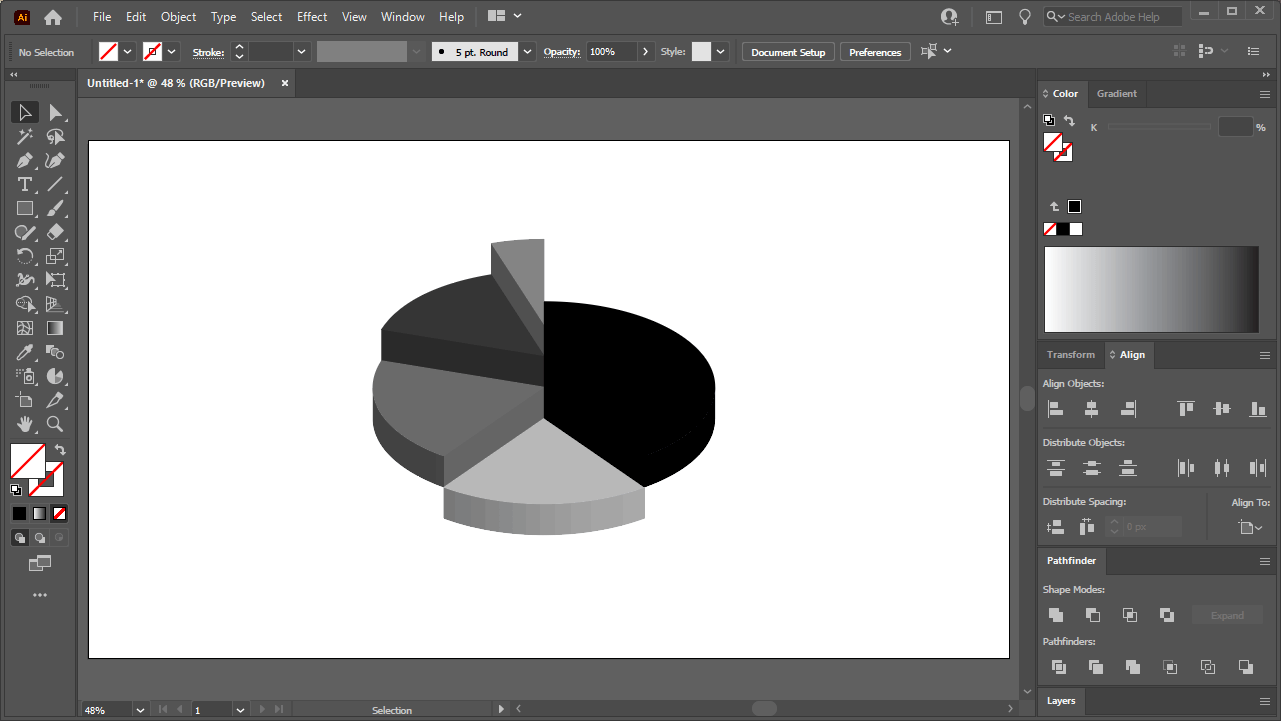
Once you’re finished, press OK. At this point your 3D pie chart should look something like this:

Although we have made our 3D pie chart in Illustrator, it’s looking rather messy at this point. Let’s correct that.
First, expand the appearance of the chart by navigating to Object > Expand Appearance. The individual segments of your 3D pie chart will now be broken up so that you can move them independently.
Stack them on top of each other, making sure to snap the corners (or “points”) so that you end up with something like this:
Before we can proceed with coloring in the pie chart, we must first ungroup it so that we can color the part individually.
To do this, select all and navigate to Object > Ungroup, or press Control + Shift + G on your keyboard. You will have to ungroup it twice.
Step 3: Add Color To Your Pie Chart
To finish making our 3D pie chart in Illustrator, we will add some color to bring this design to life and help enhance the three dimensional aspect further.
Select each individual part of the chart and apply color as you see fit. By the time you are finished, you should end up with something like this:
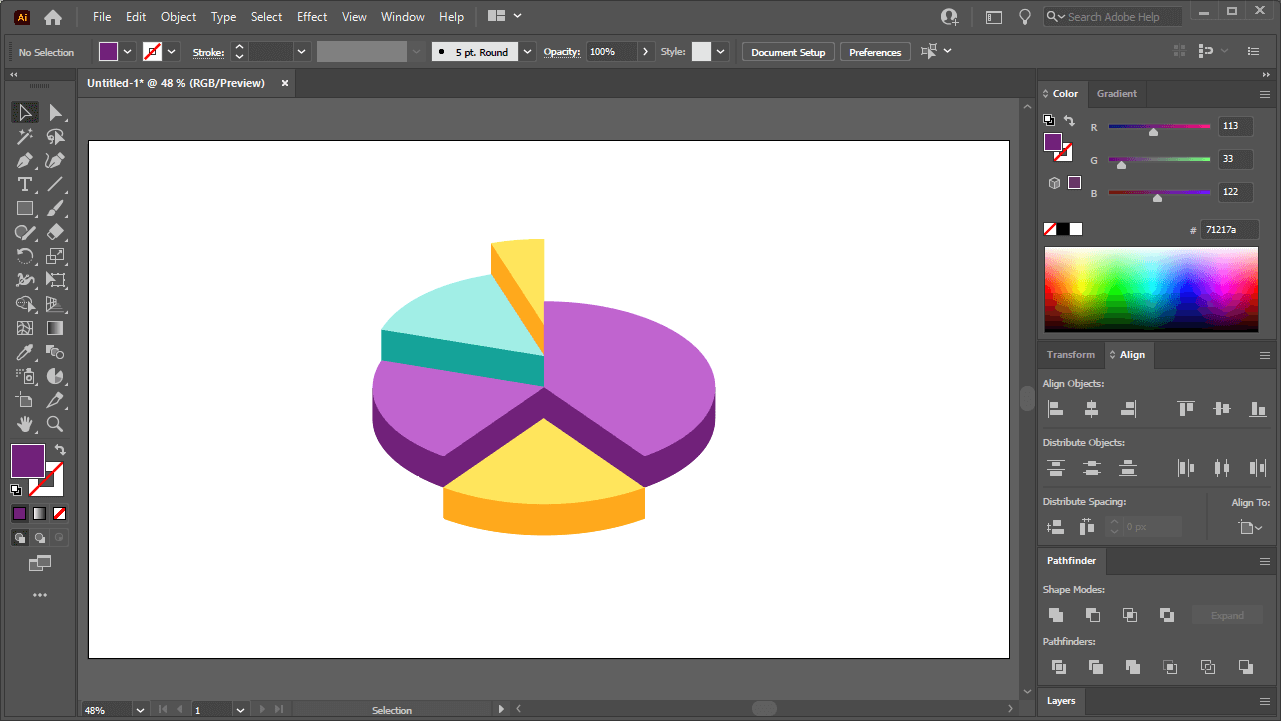
To preserve the 3D look, it is recommended that you use varying shades of the same color for each individual segment of the chart, as depicted in the above screenshot.
At this point you can save and/or export your work. We are finished! That is how you can make a 3D pie chart in Illustrator.
Conclusion
This is one of those areas where Illustrator really shines. It allows you to easily generate bars and graphs, and it also allows you to easily warp objects into 3D with its built-in features. Unfortunately, creating something like this in Inkscape or Affinity Designer would only be possible if it were manually drawn. As you can imagine, this would be incredibly time-consuming. These added bells and whistles can be real time-savers sometimes!
If you have any questions, or if any part of this lesson was unclear, simply leave a comment below.
Learn To Master The SoftwareGain a complete understanding of your favorite design apps with my comprehensive collection of video courses. Each course grants access to our private community where you can ask questions and get help when needed.
|
||||||||||||||||||||||||||||||||


Hi Nick,
Thanks for this tutorial, it’s so helpful and no more messy pie charts from Excel!
I am having trouble trying to select the individual pie section and drag it to line up with the other sections. When I hold down the Ctrl key and use the direct select tool, as you recommend, I can’t get the points on the pie shapes to appear, and therefore I can’t easily snap them to point as you show in your tutorial. I am using version 26.0.3 of Illustrator, if that helps. I believe it’s the latest version. I wish I can somehow show you a screen shot, but I hope I have described this in enough detail. Your help would be greatly appreciated. Thanks again!!
Hi Jody, I’m not sure why that would be happening. The best advice I can offer is to try re-creating the design in a new document. Or maybe try to re-create the pie chart and see if that works.